[Uploaded on April 2013, 2008, 2009 2010,and 2011 pages]
Masami Okada (MRI, JMA), Naoki Uchida (RCPEV, Tohoku Univ.), Shigeki Aoki (MRI, JMA)
Introduction
A large number of sequences of small repeating earthquakes with nearly identical waveforms have been found east offshore NE Japan. Those events are thought to be occurring on the same small asperity surrounded by creeping area on the plate boundary [Igarashi et al., 2003; Uchida et al., 2003]. They are unique data to test predictability of statistical models on renewal process as the repeaters are identified objectively by waveform cross-correlation and the recurrence intervals (1-4 years) are short enough to evaluate the performance of forecasts. In this page we explain the test for the prospective forecasts for 2011 based on a Bayesian approach [Okada et al., 2012]. We couldn't prepare new model to perform the prospective forecasts for 2012 instead of current model on stationary seismicity, because the seismicity in the study region was greatly changed by a giant earthquake of Mw9.0 on March 11, 2011.
Based on a Bayesian approach with lognormal distribution for time interval between successive repeaters, we calculated probabilities of the repeater occurrence for the period from January 1 to December 31, 2011 (Fig.1a). We applied two conditions for the repeating earthquake sequences to study: (1) Five or more repeaters occurred from 1993 to 2010, (2) Averaged magnitude is 2.75 or larger. This time, we made a forecast taking account of the regional difference of seismic activity and partitioned the study area into three sub-areas for which the inverse gamma prior distribution of variance is individually given when calculating probabilities. Observations on repeating events in the 183 forecast sequences for the period from January 1, 2011 to December 31, 2011 are shown in Fig. 1b. There are many sequences with relatively high probability near the coast line of northern part of northeastern Japan (Fig. 1a), and most of them were filled with qualifying event(s) during the forecast period (Fig. 1b). On the other hand, many of sequences with low probability in the southern area (35- 38 N) were not filled with repeaters.
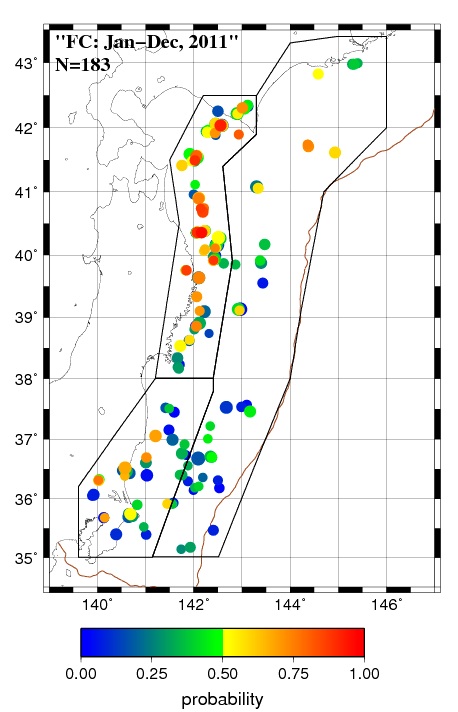 | 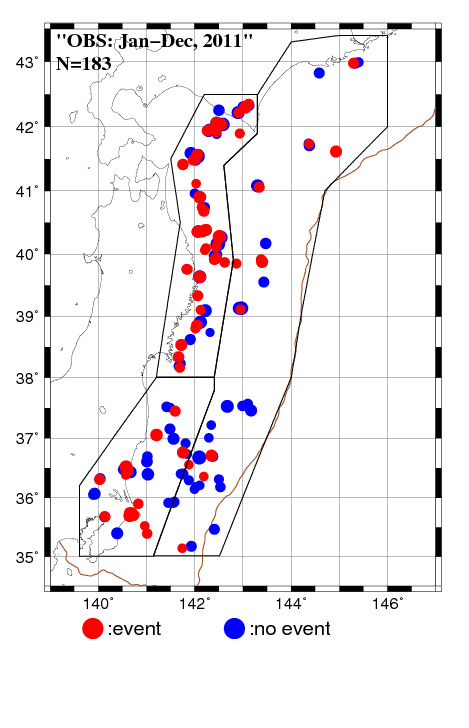 |
Fig. 1. (a) The forecast probabilities of repeater for the period from January 1, 2011 to December 31, 2011 for 183 small repeating earthquake sequences. (b) The result of observation for repeater(s) for the forecast period.
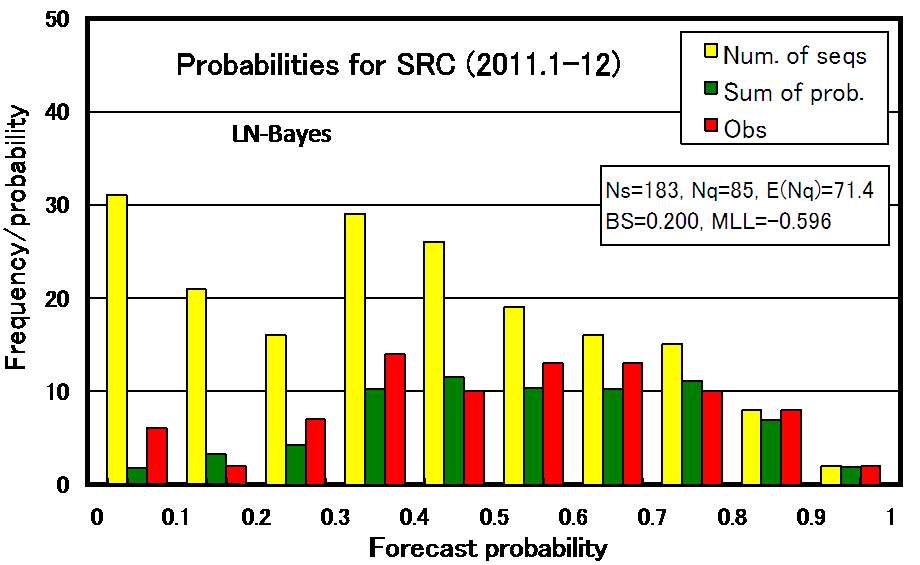 |
Fig. 2. The frequency of sequences for every 10% of the forecast probabilities. Left bar (yellow): total number of sequences in the probability range, center bar (green) : the expected number of sequences filled with repeater(s), and right bar (red): the observed number of sequences filled with repeater(s).
Next we try to verify the performance of the forecast quantitatively. The "Brier score" and "Mean log-likelihood" described below were used to score the results.
Brier score : Average of (Pq-Ev)^2
Mean log-likelihood : Average of Ev*ln(Pq)+(1-Ev)*ln(1-Pq)
Here the Pq means forecasted probability for repeater and Ev means presence (Ev=1) or absence (Ev=0) of a repeater. The model is considered to be superior to the alternative one, if the Brier score is smaller or mean log-likelihood is larger than those of the alternative. The scores for the forecast of 2011 were 0.200 for the Brier score and -0.596 for the mean log-likelihood. Figure 3 shows the change of the mean log-likelihoodÅ@in five experiments and the score for 2011 was worse than the average of the previous experiments (-0.570). We compared the Mean log-likelihood or Brier score of our results with those of probability forecast of precipitation at Tokyo, too. Here we used precipitation probability data from http://homepage3.nifty.com/i_sawaki/WeatherForecast/index.htm. The scores for the 2011 forecast indicate that the predictabilities for repeating earthquake is rather worse than those of the precipitation forecast of 7 days later (0.184 and -0.548 for Brier and mean log-likelihood scores, respectively).
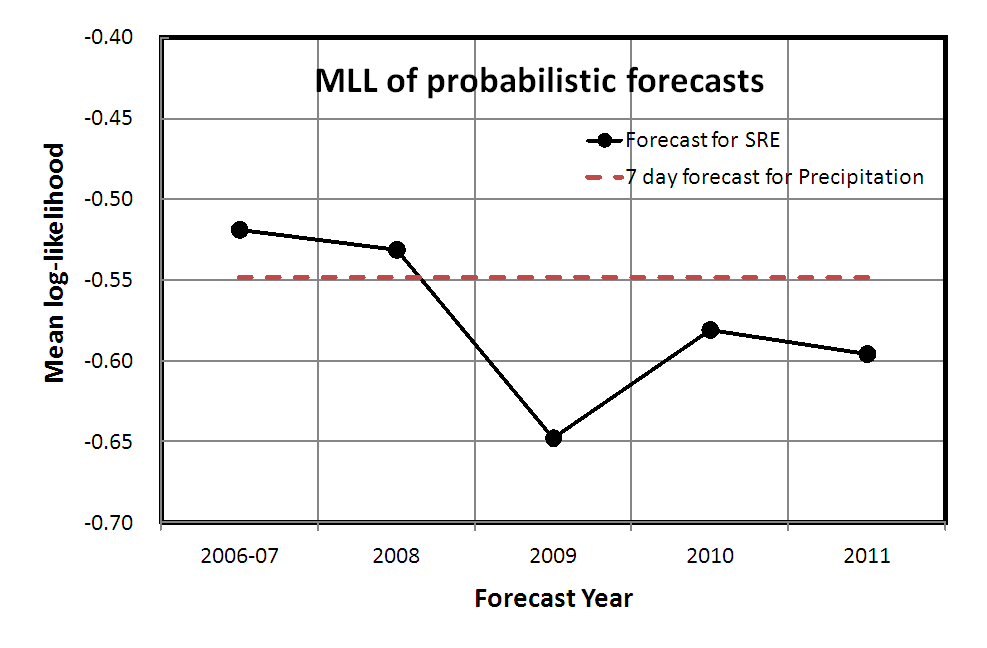
Fig. 3. The mean log-likelihood scores for five experiments of prospective forecast for small repeating earthquakes and 7 days precipitation forecast at Tokyo from 2006 to 2011.
We also conducted statistical consistency tests of the probability forecast. The scores calculated from observation (data) are compared with the theoretical distribution of scores that assumes the forecasted probabilities are correct. If the score of observation is too bad in comparison with the theoretical distribution, the model will be rejected [Schorlemmer et al., 2007]. For example, if the earthquakes are occurring randomly following the forecast probabilities, the number of sequences with event(s) follows blue line in Fig. 4. The actual number of sequences with event (red line, 85) is located at 98.9% level on probability. Therefore our forecast model is rejected at the 95% significance level. The result of log likelihood is considered to be rather bad but not extremely bad since the forecast probabilities are rejected by L-test at 95% significance level and not at 99%. For Brier score, the forecasts are slightly bad and not rejected statistically at 95% level. In addition to these tests, if we use two forecast models for the same data set, we can test the difference of score between two models. The Brier score and mean log-likelihood for the exponential distribution model that assume the earthquakes randomly occur is 0.230 and -0.651, respectively, which are significantly worse than those by the forecast model.
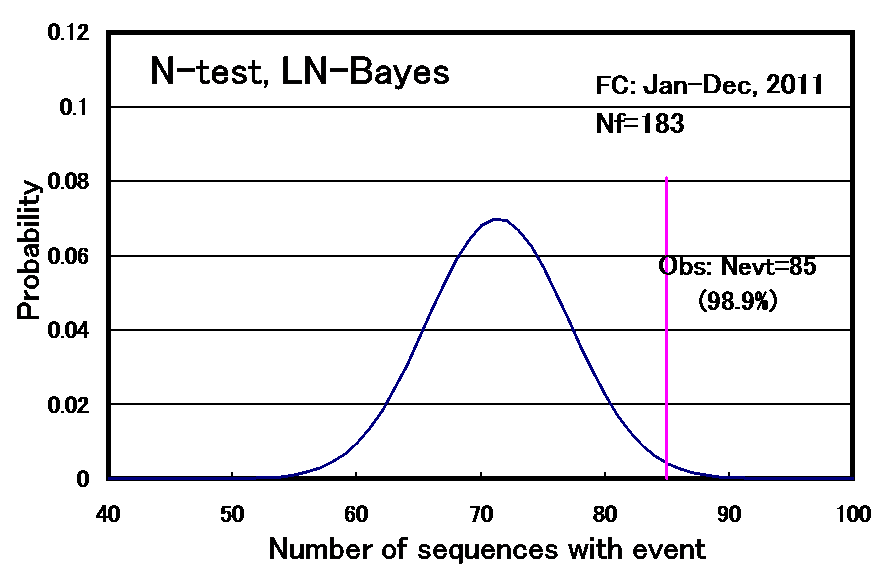 |
Fig. 4. The test based on the total number of sequences filled with repeater(s) in 2011, (N-test).
Regional partition
We partitioned the study area into three sub-areas to take account of the regional difference of repeating earthquake activity and the inverse gamma prior distribution of variance is individually given for each sub-region in the calculation of probabilities. To check the effect of the partition on the forecasts, we compare the log-likelihood of forecast model (H1) with that of alternative model (H0) used for the 2010 forecast. Here the model (H0) used for the 2010 forecast has a common prior distribution for the whole study region. Fig. 5 shows the result of comparison test, R-test, and indicates that the model (H1) used in the 2011 forecast significantly better than the alternative one (H0). Because the theoretical distribution for which H0 is correct is rejected by the observation value of R=LL(H1)-LL(H0)=2.27, that on H1 is accepted. However the effect due to the use of the regional difference in parameter seems fairly small as the score of R=2.27 is not so large.
Å@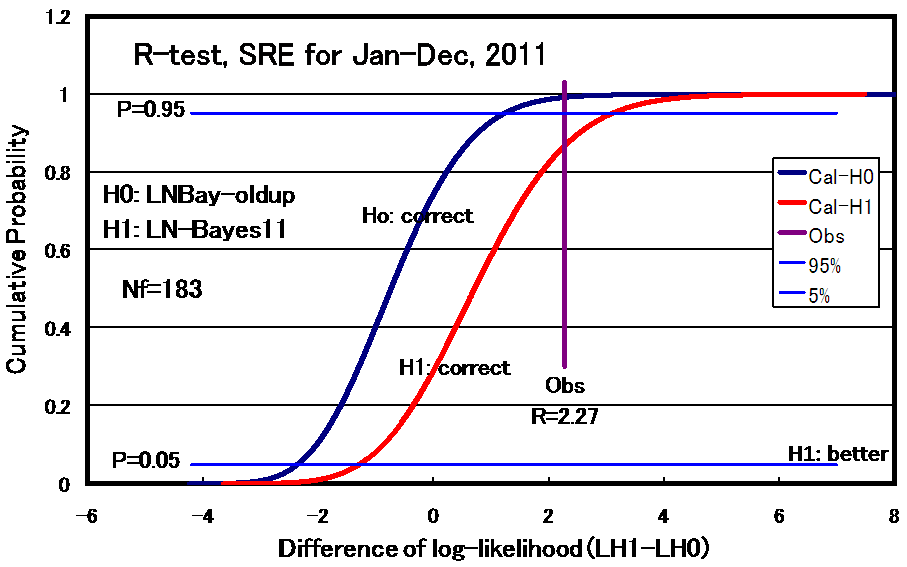 |
Fig. 5. The comparison test (R-test) based on the difference of log-likelihood scores for Baysian model of log-normal distribution with a common inverse gamma prior distribution of variance for whole study region (H0) and that with different ones for each sub-region.
Great earthquake of Mw9.0
In the forecast period a great earthquake of Mw9.0 occurred in the study area on March 11, 2011 and a large number of small aftershocks of M3+ observed by the end of 2011. The number of earthquakes in nine months reached more than 20 times of those before the great earthquake. The large increase of small events due to the occurrence of the great earthquake is the main factor that our forecasts for 2011 were rejected by the N-test in Fig. 4. The activity of repeaters was slightly quiet before the great event. It is noted that the activity of repeaters after the great events was relatively calm in comparison with the number of M3+ events. Several possible reasons are listed below; 1) We performed a binary forecast for which multiple repeats have the same count as single repeat. 2) Lots of seismometers in the seismic net work were temporally unavailable due to the earthquake disaster. Extremely active seismicity caused that the records for many events overlapped and repeaters could not be identified. 3) Stress field changed very much and the repeaters with the same mechanism as the former became stop to occurring in the wide source area. Figure 6 shows the distribution of the number of repeats in each sequence in 2011. 29 of 183 sequences have two or more repeats in the one year forecast period, which are much larger than previous experiments. You can see such conspicuous tendency in the coastal area in northern Honshu where the large afterslip of the great earthquake was estimated from the observations of GPS and strain-meters on land.
Å@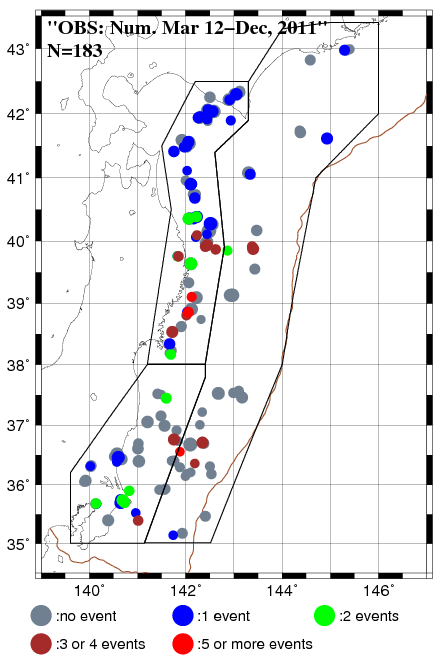 |
Fig. 6. The number of repeaters in the forecast period in each sequence.
Acknowledgement: We used waveform data not only from Tohoku university's seismic stations but also from Hokkaido University and university of Tokyo to identify small repeating earthquakes. We also used earthquake catalogue by Japan meteorological agency. We thank Hiroyuki Takayama for the drawing program used for Fig. 1.
| 1. The location, magnitude, probability and occurred earthquakes for the probability forecast for 2011 (data plotted in Figs. 1 amd 6) | probobs11.csv |
Reference
- Igarashi, T., T. Matsuzawa, and A. Hasegawa, Repeating earthquakes and interplate aseismic slip in the northeastern Japan subduction zone, J. Geophys. Res., 108, 10.1029/2002JB001920, 2003.
- Uchida, N., T. Matsuzawa, T. Igarashi, and A. Hasegawa, Interplate quasistatic slip off Sanriku, NE Japan, estimated from repeating earthquakes, Geophys. Res. Lett., 30, doi:10.1029/2003GL017452, 2003.
- Uchida, N., T. Matsuzawa, W. L. Ellsworth, K. Imanishi, T. Okada, and A. Hasegawa, Source parameters of a M4.8 and its accompanying repeating earthquakes off Kamaishi, NE Japan - implications for the hierarchical structure of asperities and earthquake cycle, Geophys. Res. Lett., 34, doi:10.1029/2007GL031263, 2007.
- Okada, M., H. Takayama, F. Hirose and N. Uchida, A prior distribution of the parameters in renewal model with lognormal distribution used for estimating the probability of recurrent earthquakes, Zisin, 60, 85-1000, 2007(in Japanese with English abstract).
- Schorlemmer, D., M. C. Gerstenberger, S. Wiemer, D. D. Jackson, and D. A. Rhoades, Earthquake likelihood model testing, Seismo. Res. Lett.,78, 17-29, 2007.
- Okada, M., N. Uchida, H. Takayama, and K. Maeda, Statistical prediction experiment and its testing for interplate small repeating earthquakes by renewal models, 7th General Assembly of Asian Seismo. Comm., Tsukuba, Nov. 2008.
- Okada, M., N. Uchida, K. Maeda, and H. Takayama, Statistical forecasts and tests for small interplate repeating events near the east coast of NE Japan in 2008, JPGU Meeting 2009, Makuhari Messe International Conference Hall, Chiba, May 2009
- Okada, M., N. Uchida, and S. Aoki, Forecast for small interplate repeating earthquakes near the east coast of NE Japan in 2009, JpGU Meeting 2010
- Okada M., N. Uchida, and S. Aoki, A new prior distribution of a Bayesian forecast model for small repeating earthquakes in the subduction zone along the Japan Trench, Workshop on "Earthquake Forecast Systems Based on Seismicity of Japan: Toward Constructing Base-line Models of Earthquake Forecasting, Uji Obaku Plaza, Kyoto Univ., Nov. 2010.
- Okada, M., N. Uchida, and S. Aoki, Statistical forecasts and tests for small interplate repeating earthquakes along the Japan Trench, Earth, Planets, and Space, 64, 703-715, doi:10.5047/eps.2011.02.008, 2012.