Masami Okada (MRI, JMA), Naoki Uchida (RCPEVE, Tohoku Univ.), and Hiroyuki Takayama (MRI, JMA)
Introduction
A large number of sequences of small repeating events with identical waveform have been found near the east coast of NE Japan. The repeating earthquakes are thought to be occurring on the same small asperity surrounded by creeping area on the plate boundary [Igarashi et al., 2003; Uchida et al., 2003]. These repeating earthquakes are unique data to test predictability of statistical models because the earthquakes are identified objectively by waveform correlation and the recurrence intervals (1-4 years) are short enough to evaluate the forecast. In this page we introduce the result of statistical forecast based on a Bayesian approach.
Å@
We use time interval of successive small repeating earthquakes. Based on a Bayesian approach with lognormal distribution, we calculated probabilities of earthquake occurrence for several time periods. Here we used the prior distribution of inverse gamma for variance parameter obtained by Okada et al. [2007].
We show the forecast (left) and actual occurrence (right) of repeating earthquakes for the period from July 2006 to July 2007. It shows that most of repeating earthquake sequences with high probability had an earthquake during the forecasting period.
Å@ |  |
Å@Fig. The comparison of statistical forecast (left) and actual occurrence (right) of repeating earthquakes Å@for the period from July 2006 to July 2007ÅD
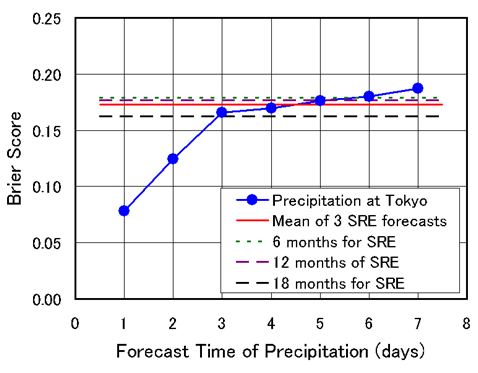
Next we try to verify the performance of the forecast. The "Brier score" and "Mean log-likelihood" described below were used to score the results.
Brier score : Average ofÅ@(Pq-Ev)^2
Å@Pq means forecasted earthquake occurrence probability and Ev means
presenceÅiEv=1Åjor absenceÅiEv=0Åjof earthquake. Å@
The model is considered to be superior to the alternative one,
if the Brier score is smaller than those of the alternative.
Mean log-likelihood : Average of Ev*ln(Pq)+(1-Ev)*ln(1-Pq)
The model is considered to be superior to the alternative one, when the score is larger than those of the alternative
 |
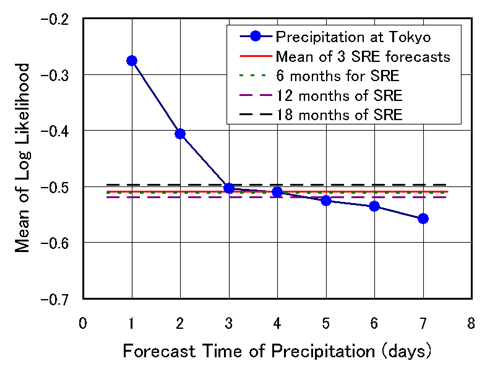 |
Å@Fig. The Brier score(Upper) and Mean log-likelihood (lowerÅj Å@with the result of daily probability forecast of rainfall at Tokyo in 2006.
Å@
Figure shown below is the prospective forecast of repeating earthquakes in 2008. The score of the forecast is unknown now (on July 2007). We will try to improve the prediction by comparing of various statistical models and/or adoption of physical model.
- Igarashi, T., T. Matsuzawa, and A. Hasegawa, Repeating earthquakes and interplate aseismic slip in the northeastern Japan subduction zone, J. Geophys. Res., 108, 10.1029/2002JB001920, 2003.
- Uchida, N., T. Matsuzawa, T. Igarashi, and A. Hasegawa, Interplate quasistatic slip off Sanriku, NE Japan, estimated from repeating earthquakes, Geophys. Res. Lett., 30, doi:10.1029/2003GL017452, 2003.
- Okada, M., H. Takayama, F. Hirose and N. Uchida, A prior distribution of the parameters in renewal model with lognormal distribution used for estimating the probability of recurrent earthquakes, Zisin, 60, 85-1000, 2007(in Japanese with English abstract).
Acknowledgement:
We used waveform data not only from Tohoku university's seismic stations but also from Hokkaido university and university of Tokyo to identify small repeating earthquakes.
We also used earthquake catalogue by Japan metrological agency.