[Uploaded on March 2010, 2008 and 2009 pages]
Masami Okada (MRI, JMA), Naoki Uchida (RCPEVE, Tohoku Univ.), Shigeki Aoki (MRI, JMA)
Introduction
A large number of sequences of small repeating events with identical waveform have been found near the east coast of NE Japan. The repeating earthquakes are thought to be occurring on the same small asperity surrounded by creeping area on the plate boundary [Igarashi et al., 2003; Uchida et al., 2003]. These repeating earthquakes are unique data to test predictability of statistical models because the earthquakes are identified objectively by waveform correlation and the recurrence intervals (1-4 years) are short enough to evaluate the forecast. In this page we introduce the result of statistical forecast based on a Bayesian approach.
We use time interval of successive small repeating earthquakes. Based on a Bayesian approach with lognormal distribution, we calculated probabilities of earthquake occurrence for the period from January 1 to December 31, 2010 (Fig.1). We applied three conditions for the repeating earthquake sequences to study : (1) Five or more earthquakes are occurred from 1993 to 2009, (2) Averaged magnitude is 2.75 or larger, and (3) The number of aftershocks of the 2003 Tokachi-oki earthquake (M8.0) and 1994 Sanriku-oki earthquake (M7.6) are less than 1/3 of the sequence. This time, we made a forecast for 163 sequences which satisfy above criteria.
 |
Fig. 1. The probabilities of earthquake occurrence for 163 small repeating earthquake sequences in 2010.
Figure 2 shows the forecast (left) and actual occurrence (right) of 145 repeating earthquake sequences for the period from January 1, 2009 to December 31, 2009. There are many groups with relatively high probability near the coast line of northern part of northeastern Japan (left figure), and most of repeating earthquake sequences with high probability had an earthquake during the forecasting period.
 |  |
Fig. 2. The comparison of statistical forecast (left) and actual occurrence (right) of repeating earthquakes for the period from January 1, 2009 to December 31, 2009.
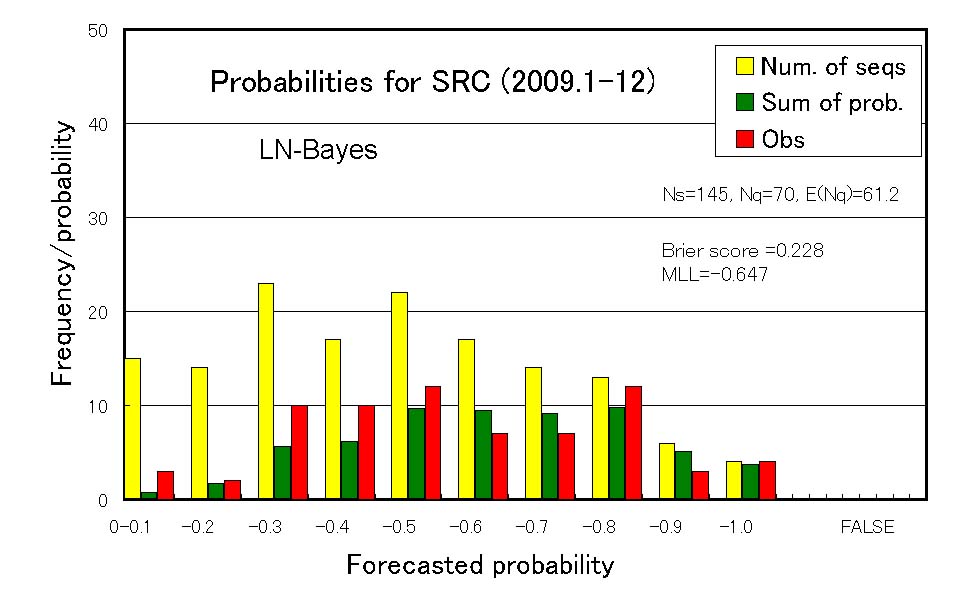
Fig. 3. The frequency distribution of forecasted (green) and actual (red) number of sequences that had a earthquake in 2009 for every 10% probability. The sum of yellow and green parts show total number of sequences.
Next we try to verify the performance of the forecast quantitatively. The "Brier score" and "Mean log-likelihood" described below were used to score the results.
Brier score : Average of (Pq-Ev)^2
Pq means forecasted earthquake occurrence probability and Ev means presence (Ev=1) or absence (Ev=0) of the forecasted earthquake. The model is considered to be superior to the alternative one, if the Brier score is smaller than those of the alternative.
Mean log-likelihood : Average of Ev*ln(Pq)+(1-Ev)*ln(1-Pq)
The model is considered to be superior to the alternative one, when the score is larger than those of the alternative.
The scores for the forecast of 2009 were 0.228 for the Brier score and -0.647 for the mean log-likelihood. We compare the Mean log-likelihood of our results with the result of probability forecast of precipitation at Tokyo from 2006 to 2009 (Fig. 4). Here we used precipitation probability data from http://homepage3.nifty.com/i_sawaki/WeatherForecast/index.htm. The score for 2009 show that the earthquake predictability is lower than that of the precipitation forecast of the 7 days later. The Brier score which is not shown here also shows similar result.
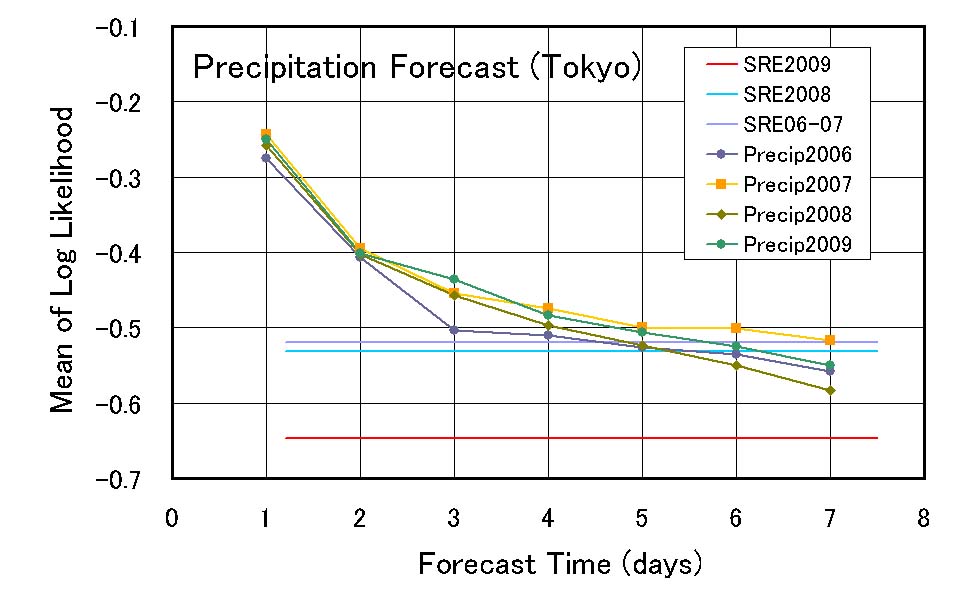 |
Fig. 4. Comparison of the result of probability forecast in 2008 and 2009 with the result of daily probability forecast of precipitation at Tokyo.
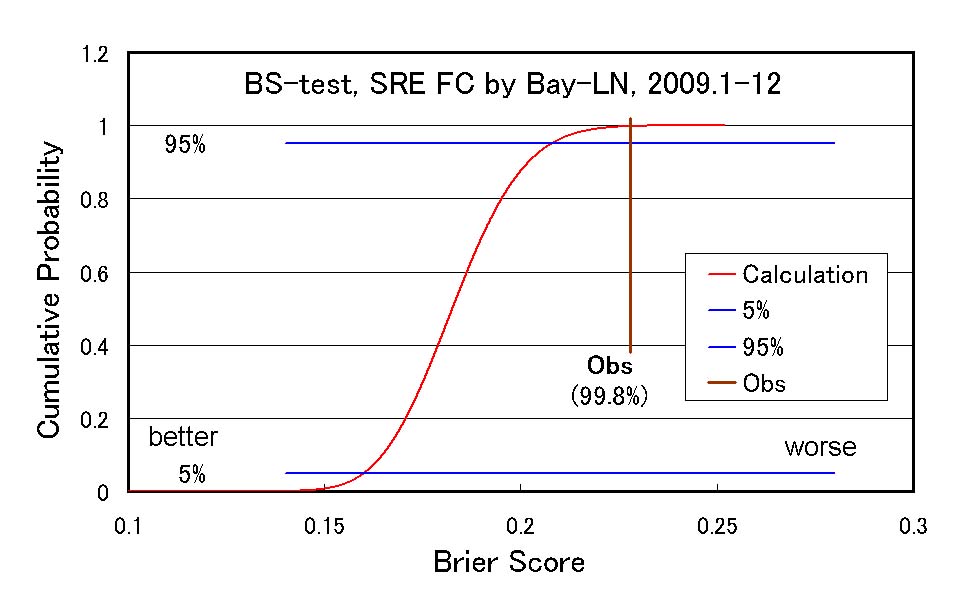
We also performed statistical test of the probability forecast. We compare the theoretical distribution of scores that assumes the forecasted probability is correct and the score that is estimated from observation (data). If the score is bad, the model will be rejected [Schorlemmer et al., 2007]. For example, if the earthquakes are occurring randomly following the present probability, the distribution of Brier score follows red line in Fig. 5. Here, the result with Brier score larger than 95% probability will be rejected and present Brier score (0.228, brown) is rejected. However, the test using the number of sequences with earthquakes (N-test, Fig. 6) is not rejected.
 |
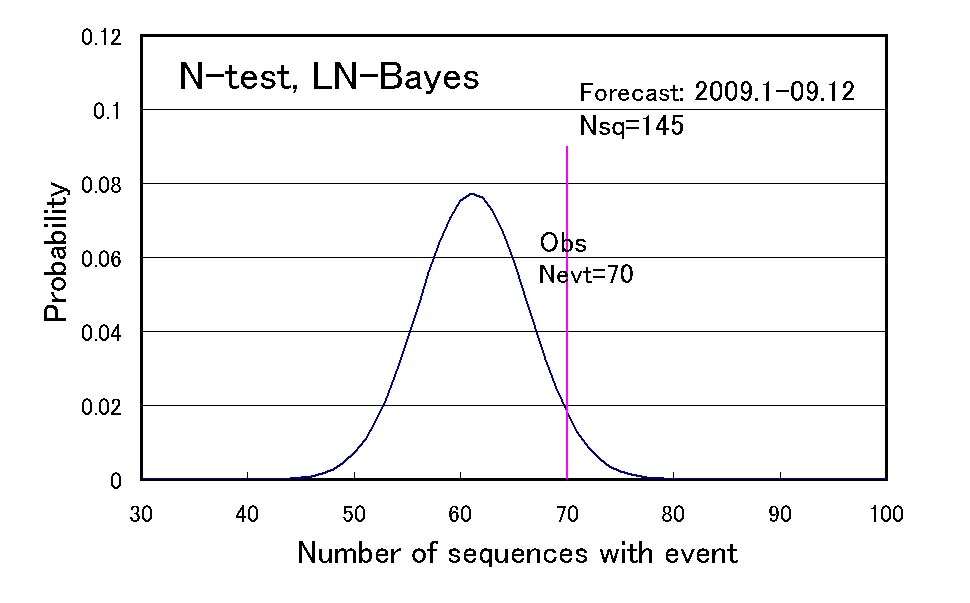 |
Fig. 6. The test using the number of earthquake (N-test).
In addition to these tests, if we use two models for the same dataset, we can test the difference of score for the two model. The Brier score and mean log-likelihood for the exponential distribution model that assume the earthquakes are randomly occurring is 0.251 and -0.696, respectively. We show in Fig. 7 the result of R-test that use the difference in summed log-likelihood for all the sequences (R). If the exponential distribution model is true, the distribution of 'R' become blue line (Cal-H0). Since the observed 'R' (7.09) is larger than 95% point, the exponential distribution model is rejected. If our model is correct, the distribution of 'R' become red line (Cal-H1) and this is not rejected. This shows our model is significantly superior to the exponential distribution model.
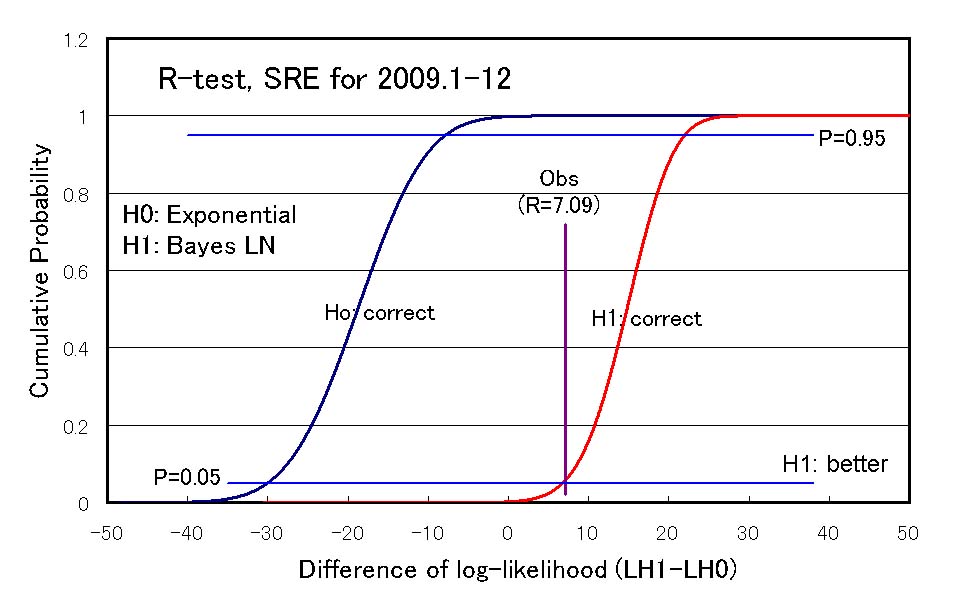 |
Fig. 7. The test of the difference in log-likelihood (R-test) for exponential distribution model (H0) and probability model in this study (H1).
The statistical test for the 2009 forecast by Brier score and mean log-likelihood are rejected and the scores are significantly decreased compared to the 2008 forecast. We consider the cause of this failure is due to large afterslip of the Ibaraki-oki earthquake (M7.0, May 2008) and Fukushima-oki earthquake (M6.9, July 2008)[Uchida et al., ASC, 2008]. Incorporating physical model for the forecast is one of the issue what remains to be done.
Acknowledgement: We used waveform data not only from Tohoku university's seismic stations but also from Hokkaido university and university of Tokyo to identify small repeating earthquakes. We also used earthquake catalogue by Japan meteorological agency. We thank Hiroyuki Takayama for the drawing program used for Fig. 1 and 2.
| 1. The location, magnitude, probability and occurred earthquakes for the probability forecast for 2008 (data plotted in Fig. 2) | probobs09.csv |
| 2. The location, magnitude and probability for 2009 (data plotted in Fig. 1) | prob10.csv |
Reference
- Igarashi, T., T. Matsuzawa, and A. Hasegawa, Repeating earthquakes and interplate aseismic slip in the northeastern Japan subduction zone, J. Geophys. Res., 108, 10.1029/2002JB001920, 2003.
- Uchida, N., T. Matsuzawa, T. Igarashi, and A. Hasegawa, Interplate quasistatic slip off Sanriku, NE Japan, estimated from repeating earthquakes, Geophys. Res. Lett., 30, doi:10.1029/2003GL017452, 2003.
- Uchida, N., T. Matsuzawa, W. L. Ellsworth, K. Imanishi, T. Okada, and A. Hasegawa, Source parameters of a M4.8 and its accompanying repeating earthquakes off Kamaishi, NE Japan - implications for the hierarchical structure of asperities and earthquake cycle, Geophys. Res. Lett., 34, doi:10.1029/2007GL031263, 2007.
- Okada, M., H. Takayama, F. Hirose and N. Uchida, A prior distribution of the parameters in renewal model with lognormal distribution used for estimating the probability of recurrent earthquakes, Zisin, 60, 85-1000, 2007(in Japanese with English abstract).
- Schorlemmer, D., M. C. Gerstenberger, S. Wiemer, D. D. Jackson, and D. A. Rhoades, Earthquake likelihood model testing, Seismo. Res. Lett.,78, 17-29, 2007.
- Okada, M., N. Uchida, H. Takayama, and K. Maeda, Statistical prediction experiment and its testing for interplate small repeating earthquakes by renewal models, 7th General Assembly of Asian Seismo. Comm., Tsukuba, Nov. 2008.
- Okada, M., N. Uchida, K. Maeda, and H. Takayama, Statistical forecasts and tests for small interplate repeating events near the east coast of NE Japan in 2008, JPGU Meeting 2009, Makuhari Messe International Conference Hall, Chiba, May 2009
- Okada, M., N. Uchida, and S. Aoki, Forecast for small interplate repeating earthquakes near the east coast of NE Japan in 2009, JpGU Meeting 2010