At 02:46:23 PM(JST), on Friday, March 11, 2011, the huge earthquake of M 9.0 occurred beneath the Pacific side of the northeastern Japan from Tohoku to Kanto area and it has caused one of history’s worst human and property damages. Although it is very difficult to estimate the extent of damage accurately at this moment, there is no question that this earthquake caused the greatest damage never before experienced by us. We wish to extend our deepest condolences to all those affected by the 2011 off the pacific coast of Tohoku Earthquake.
Study Results of The Tohoku Earthquake
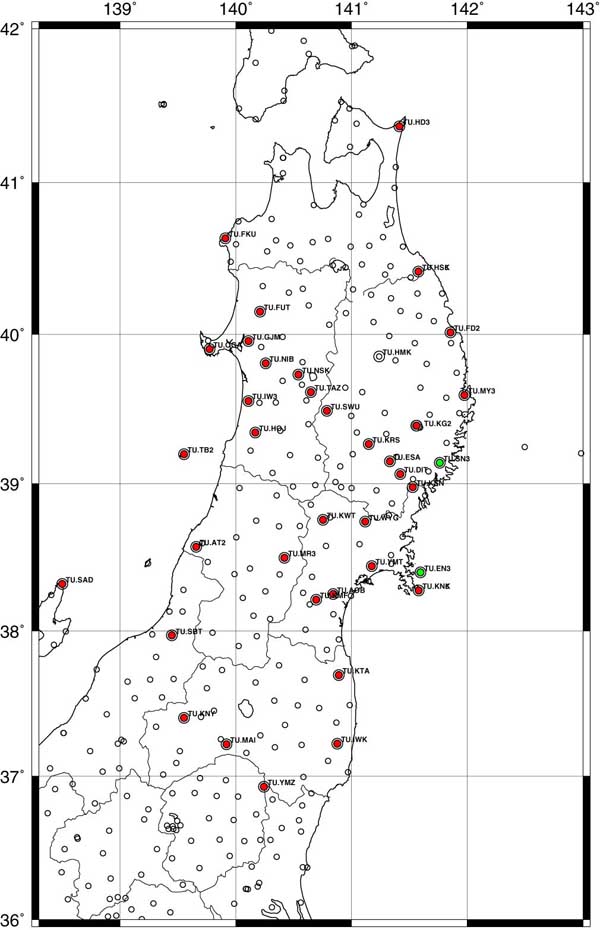
Seismic stations of Tohoku University [2011/4/3]
Tohoku University is providing seismic data to JMA for the nation-wide earthquake monitoring. This figure shows the state of seismic stations on March 21. Large circles are stations belonging to Tohoku Univ. Red color circles show on-line stations and green color show off-line stations. (Text by N. Umino, N. Uchida and T. Nakayama)
Co-seismic displacement estimated from high-sampling kinematic GPS analysis
The analysis result of 1-sec sampling data obtained from GPS observation site installed at Aobayama Observatory, Tohoku University. We used RTKLIB Ver. 2.4.0 (Takasu, 2010) for the analysis and IGS Rapid orbit information. Horizontal axes indicate time (min) between 2:44 – 2:53PM (UTC). IGS’s USUD station is used as a fixed site for the analysis. Distinct permanent displacements can be seen in all components after 2:47PM. Particularly in the east-west component, 4.06m eastward displacement is detected about a minute after the main shock. 2 more minutes after that, the displacement is restored to 2.4m. Also, we can see about 0.5m southward displacement in the north-south component and about 0.09m subsidence in the up-down component. It takes 3 minutes to convergence to the permanent displacement;. We think that this roughly corresponds to the duration of the fault rupture. (Text by Y. Ohta)
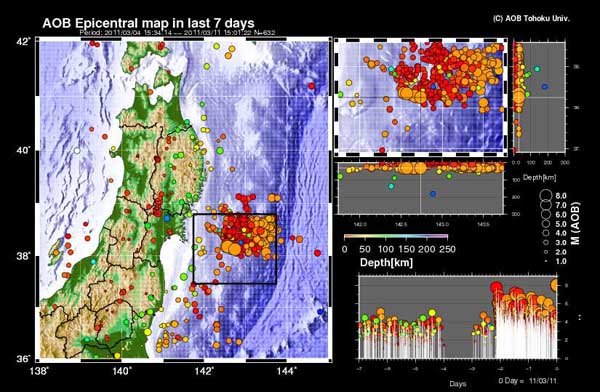
Relationship between mainshock hypocenter and aftershock of the 2011 March 9 earthquake (M7.3)
One week seismicity before March 11 15:01, 2011 (JST) by automatic hypocenter determination system at Tohoku University. Hypocenter of the 2011 mainshock is located near the center of the rectangle. The rupture of the 2011 earthquake started near the southeast edge of the aftershock area of the 2011 March 9 earthquake. (Text by N. Uchida)
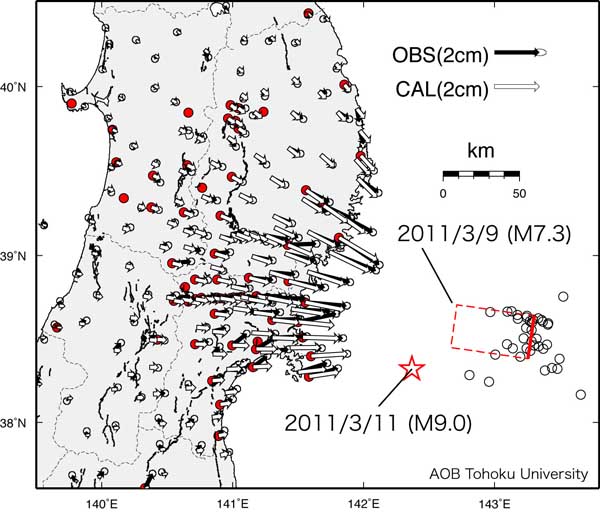
Relationship between the coseismic fault of the 2011 March 9 earthquake (M7.3) and the epicenter of the 2011 off the pacific coast of Tohoku Earthquake(M9.0)
3The comparison of the hypocenter of the 2011 off the pacific coast of Tohoku Earthquake with the coseismic fault model of off Sanriku earthquake of March 9, 2011 (M7.3). The fault model of March 9 is estimated based on daily coordinate of GEONET, Tohoku university (red circles), and JNES GPS data (red rectangle). Nonlinear inversion method by Matsu’ura and Hasegawa (1987) is used for the estimation. There is a complementary relationship between the estimated earthquake source fault and the re-measured and relocated aftershock distribution of the March 9 earthquake (black circles indicate aftershocks occurred by 10PM, March 9). The calculated moment magnitude is 7.18 (assuming that the modulus of rigidity is 40GPa). The estimated fault model explains well the observed values . The epicenter of the 2011 off the pacific coast of Tohoku Earthquake(determined by USGS) is located on the deeper extension of the estimated coseismic fault model of March 9. The following are the estimated fault parameters of March 9 earthquake.
| Lon.(°) | Lat. (°) | Depth(km) | Length(km) | Width(km) | Strike(°) | Dip(°) | Rake(°) | Slip (m) |
| 143.30 | 38.64 | 16.0 | 28.7 | 53.2 | 188.2 | 12.0 | 73.3 | 1.25 |
(Text by Y. Ohta, T. Iinuma, M. Ohzono and S. Miura, Initial fault model by T. Iinuma)
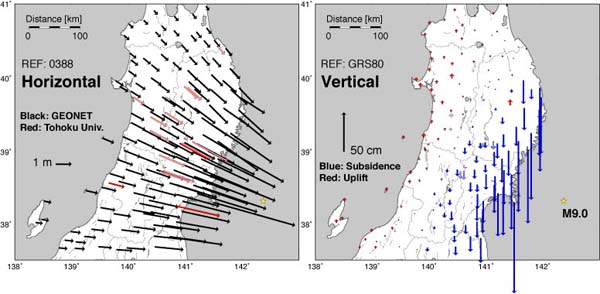
Coseismic crustal deformation derived from GPS observations by Tohoku University and GEONET
GPS data from Tohoku University and GSI (Geospatial Information Authority of Japan) are analyzed to reveal coseismic crustal deformation associated with the 2011 off the Pacific coast of Tohoku Earthquake. We used Bernese GPS Software ver. 5.0 with the IGS Rapid GPS ephemeris. Left figure is the horizontal displacement. (black: observed at GEONET stations, red and pink: observed at stations by Tohoku university). Right figure is vertical displacement (blue and red indicate subsidence and uplift, respectively). Coseismic displacement is defined by the difference between the site coordinates on the day before the mainshock (March 10) and those after the mainshock, March 11 (red or blue) or March 12 (pink or light blue). We can see the maximum displacements of about 5.3 m in horizontal, and 1.1 m in vertical component at the Oshika station. (Text by M. Ohzono and S. Miura)
Relationship between source area and interplate coupling
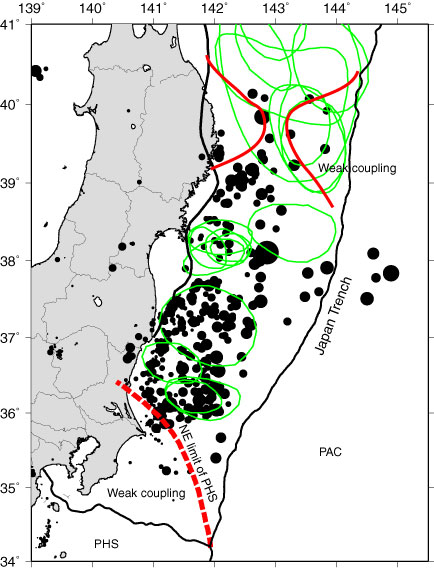
This figure shows 24 hours aftershock (black circles) by JMA and feature of the interplate coupling.Green regions show aftershock areas of M>7 earthquake from 1923. The 2011 aftershock area encompass several M7 earthquake’s aftershock areas. The aftershock area that probably includes co-seismic slip area is mainly located in-between weak coupling area that are shown by red lines (See next section for the weak coupling areas). (Text by N. Uchida)
Spatial distribution of interplate coupling in NE Japan subduction zone
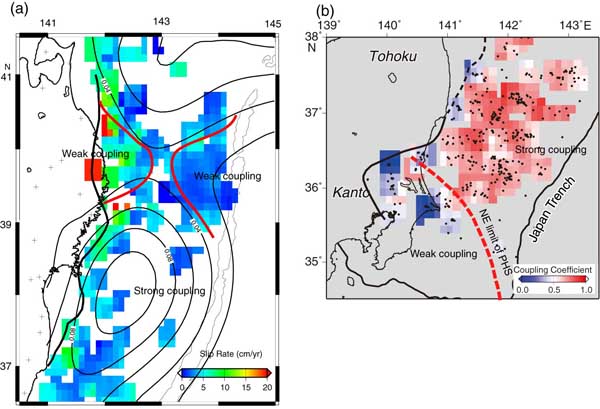
Figure (a) shows quasi-static slip rate on the NE Japan plate boundary, and Figure (b) shows the coupling rate. The quasi-static slip rate and the coupling rate are in the inverse relationship. Where the squasi-static slip rate is high, the coupling rate is low (the coupling is weak); where the steady-state slip rate is low, the coupling rate is high (the coupling is strong). It is thought that seismic slips are prone to occur in the areas where the coupling rate is high. Both figures are obtained from the data of small repeating earthquakes. Fig.(a) indicates the slip rate during the period of 1997 to 2001(Doctoral thesis by Uchida), and Fig. (b) indicates the coupling rate during the period of 1992 to 2007 (Uchida et al.,EPSL, 2009). The contours in Fig.(a) indicate slip deficit rate determined by GPS data(Suwa et al., JGR, 2006;the larger the value , the higher the coupling rate.)We can see the areas where the coupling rate is low in the Pacific off Iwate (~40N, Fig. a) and east off Kanto (Fig. b). (Text by N. Uchida)
Quasi-static slip around the focal area prior to the 2011 off the pacific coast of Tohoku Earthquake
Space and time variation of quasi-static slip on the plate boundary estimated by cumulative slip of small repeating earthquakes. The dates at the upper left indicate the period of the analysis (3 years), and the color indicates slip velocity during the period. Red stars indicate earthquakes of magnitude 7 or larger which occurred at depths shallower than 70km. Two rectangles indicate the mainshock fault model by GSI http://www.gsi.go.jp/cais/topic110313-index.html). The contours in the figures indicate the slip distributions of 2003 Tokachi-oki earthquake and of 1994 Far-off-Sanriku earthquake (Yamanaka and Kikuchi, EPS, 2003, JGR, 2004 ). Black thick line indicates the north eastern limit of the Philippine Sea plate (Uchida et al., EPSL, 2009). For convenience of the analysis, the slip rate in southern part beyond this line is provisional. At the updip (shallower part ) of earthquake source fault, we can see high slip velocity along with the Japan trench which wasn’t detected prior to 2008 (around the red ellipse in the upper right figure). Its north-south extent approximately corresponds with the slip area of the 2011 earthquake. We consider that this preseismic quasi-static slip which occurred in the area broadening from north to south near the trench is associated in some way with the occurrence of this massive earthquake. In the previous study minor preseismic slip was also observed prior to 1994 Far off Sanriku earthquake (M7.6) and 1989 M7.1 earthquake along the Japan Trench (Uchida et al., Tectonophysics, 2004).(Text by N. Uchida)
Activity of off Kamaishi repeating earthquakes
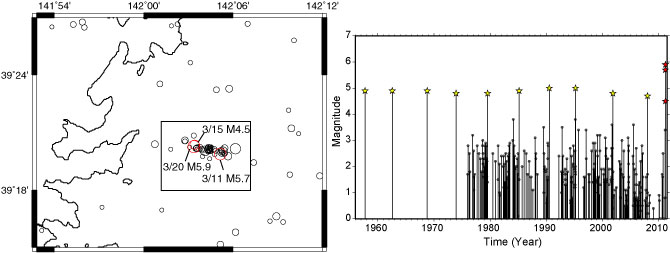
In the earthquake cluster off Kamaishi, Iwate prefecture, it’s noted that M5 earthquakes has occurred at about 5-year intervals since 1957 (Matsuzawa et al., GRL, 2002). However, it has turned out that earthquakes of magnitude 4.5 or larger occurred three times in the cluster in 9 days after this earthquake. The left figure shows the epicenter distribution after 1994 located by the double-difference location method determined by P- and S-wave arrival times reported by JMA. Red circles indicate the activities after 2011 Tohoku earthquake. Right figure is the M-T diagram after 1957 in this cluster. (The diagram shows the relationship between the magnitude of earthquakes and the timing of earthquake. However, prior to 1975, only the earthquake sequence is shown.) Two of the earthquakes occurred this time occurred 1 hour after and 9 days after the mainshock and the magnitudes were about 1 larger than ever before. Up to now, although it was known that its occurrence interval changes due to the occurrence of the surrounding large earthquakes (Uchida et al., EPSL, 2005), the fluctuation had been a year or so. Because of the large afterslip caused by 2011 Tohoku earthquake, we think that quasi-static slips on the plate boundary around this earthquakes cluster were accelerated more than ever before in this 50 years and that the occurrence interval became extremely short. As for the difference in the magnitude of the earthquakes, we think that it’s because of the external disturbance. We will look at it in greater detail. (Text by N. Uchida)
Inland earthquakes in NE Japan after the 2011 Off the Pacific Coast of Tohoku Earthquake
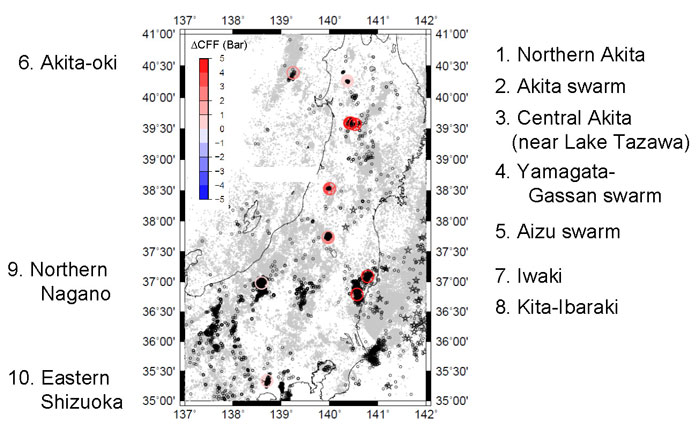
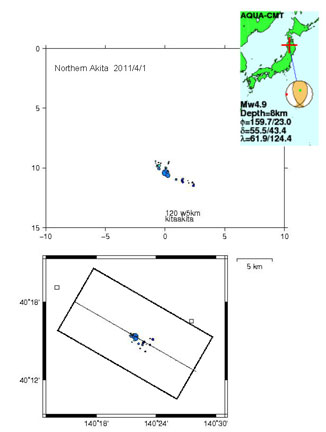
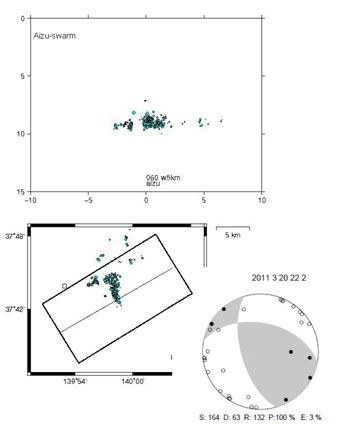
We estimated the focal mechanisms and the detailed relocated hypocenter distribution for some of shallow inland earthquakes ocurred after the 2011 Off the Pacific Coast of Tohoku Earthquake. The estimated coulomb stress change for the plausible fault of the post-event inferred by the focal mechanism and the relocated hypocenter is positive and suggests the static stress transfer possibly trigger the post- inland earthquakes.

